First Kaggle notebook reading and data-centric AI for Native AI


So I started reading some Kaggle notebooks. There are some great models and visualizations people have built in these competitions. Lots of bar charts, histograms & many scattered plots people have spoken about. I was going through a medium blog of a person who had won about 5 Kaggle competitions. She had enlisted some learnings about the datasets and the final visualizations in a big blog post. It is really heartening to see people put in the effort and then generously share their learnings so often. Reading through that post about how to create good datasets and configure data and then build visualizations on top of that, I was led to a competition which is still running. It is organized by an organization called CDP which is a not for profit. CDP works in the field of environment and water conservation and has huge datasets compiled for cities the world over. They try to among other things, list which cities are performing better than others on these metrices.
And in this particular Kaggle competition, they allow external datasets as well. One such external dataset I saw was from Simple maps. It is a US cities dataset. And it is very well organized ofourse with information from the US Geological survey and the Census Beaureu. And then I started poring over over dataset and the associated columns and the nomenclature. There was a lot of meta information available as well. As I was perusing through all of that, my earlier hypotheses about Natively Intelligent systems in the Data-Centric AI paradigm started to re-emerge. There was so much of business specific and topic specific information on that dataset. I shall attach some of the FAQs listed on that dataset for your perusal also so you get an inkling of the same. Point is, there is a lot of business specific domain knowledge in any dataset. One, it is the different formats an numbers of columns and importance for individual columns that would differ for each problem statement and the associated dataset. Two, there are the business nuances. Then going back to the electricity analogy. The different appliances have different intelligence to function natively with the power from the same grid. Likewise, I understand the performance of any AI system or a Machine Learning system including the accuracy and the computation power utilized shall depend upon how easily it understands a dataset. And how much it is possible to tweak it with and by the business intelligence. The management included that is. Also, one where these understandings are translated quickly to better adjustment in algorithms and different weights & biases afforded to them. Or the Hyperparameter Optimizations. The quicker the feedback and change say even in way of eliminating a couple columns, the faster the performance metric and less utilization of the computation power because it shall be set in the right direction initially. And that is what a neuricity grid like newron.ai would help you do. Get better performance cheaper and faster. By putting some checks and balances all along. Now this is not an expert opinion on the topic. I believe the field of AI in terms of its business applications beyond the Kaggle competitions is in a very nascent stage and hence no one could hazard final opinions.
But I do believe now that the first phase of the subtle AI tools as I may call them based on my explanation of the tools in my last blog shall involve building some kind of Natively intelligent systems. And deal with associated KPIs quicker. Systems that understand and utilize these datasets very well in a localized manner. And hence it shall be a very important task to first understand the sectors where these business applications would be best applied. What are the use cases where the Native intelligent systems shall be built fastest with maximum impact. Agri, manufacturing, travel, hospitality, Healthcare? That shall define the progress in AI as fresh capital is injected only when there is success and signs of early promise in any experiment.
Now back to the dataset I spoke about with the associated FAQs. I list those here so you could have a glimpse on how specific a dataset gets with its requirements and criterion. The expert Data scientists would find this rudimentary and could skip it. But the real issue is not understanding the complexities and nuances of a dataset, but to build Native Systems that make these datasets work well with AI outcomes.
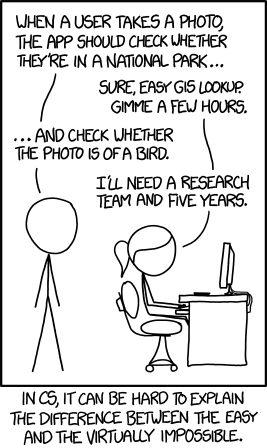
And then I came across another Kaggle notebook, one maintained by fastai. As part of a course they offer. This is of a model to identify if an image you supply is that of a bird. It uses the apparently popular and powerful Resnet18 model and they show how the model is so powerful now that the attached joke from history is now a joke. So you see how fast the GPU development has ushered in an era of transformation in AI applications. The neural net seem to be constrained by the paraphernalia, in this case, the hardware.
Another very pertinent dataset on Kaggle you can check out is the International Skin Imaging Collaboration Image dataset which shall help in the detection of Melanoma. When trained on appropriate models.
Cancer: Malignant vs. Benign dataset.
As per analyticsvidya, the dataset contains 3600 images of benign skin moles and malignant skin moles. The dataset has 2 major folders apparently, namely test and train. Both the train and test folder contain 2 folders namely benign and malignant. Inside the train folder, the benign folder has 1440 images while the malignant folder has 1197 images. Inside the test folder, the benign folder has 360 images while the malignant folder has 300 images. All the images have the same dimension – 224×244.
They have used the Xception model based on the weights and biases of Imagenet model. You can do transfer learning which I suppose freezes the weights & biases afforded to every experimentation with various w & b on each layer and record the runs. You can use the services offered at newron.ai to track these runs and identify the best data-model weights which afford the best accuracy. There is an activation function called Sigmoid that they have employed on the final output of the NN which is a binary 1 or 0.
So you can see how the dataset and the EDA part with preprocessing becomes a very crucial part of the plan. And increasingly so.
CDP external dataset Kaggle competitions FAQ. Simplemaps.com
Is the Basic (free) version sufficient for my needs?
The Basic (free) database will meet many users' needs. You may want to purchase the Pro or Comprehensive versions if:
- You need data for rural towns/villages or places that aren't incorporated municipalities.
- You need demographic data such as age, race, education or income.
- You don't want to (or can't) attribute your use of our data on a public-facing website.
What is an unincorporated populated place?
These are typically rural towns/villages that have commonly known names but do not exist as legal entities.
Do you omit any populated places?
Yes. For clarity we don't show multiple places with the same name in the same state. We only show the most important place of a given name in each state. The only exception to this is when multiple places with the same name are tracked by the Census (signaling their importance). Also, we omit some unincorporated places that are particularly insignificant.
Do you include townships?
Townships are technically county subdivisions and often act more like a county than a city/town. However, in the Northeast many townships are functionally equivalent to cities. Therefore, we include townships in the following states: ME, VT, NH, MA, RI, CT, NJ, NY, PA. If a place is a township the field township is TRUE.
Am I allowed to redistribute the database if I purchase a paid license?
No. You are not allowed to sell the database or make it publicly available. However, you can make copies and backups of the data. You are also allowed to query the database to power publicly facing applications such as a store locator. To learn more, read the full license terms.
How often do you release updates?
It depends, we monitor our sources and release new versions when we have more current data, typically a few times a year. Upon purchase, you can elect to receive email alerts when we release new versions of the database.
Why should I trust this data?
This database was aggregated from authoritative sources and carefully processed by SimpleMaps. We've been developing and selling interactive maps to Fortune 500 companies and prominent international organizations for over 11 years. Over this time, we've learned a lot about geographic data. To get a sense of the expertise and support we offer, check out some of the testimonials from our happy customers.
If I use the free database, what type of attribution is required?
If you use the Basic (free) database, you must link back to this page:
https://simplemaps.com/data/us-cities
from a public webpage where you are using the data. If you want to use the data internally, you must link back to this page from your firm's website on a page that can be easily found though links on the root domain. The link must be clearly visible to the human eye.
How recent are the demographic variables such as income_household_median?
All of the demographic variables come from the 2020 American Community Survey (5-year estimate) which is run by the United States Census Bureau.
How come some demographic variables are blank (empty strings) for some cities?
Demographic variables are only available for places recognized by the Census. Also, the Census Bureau will only provide demographic data if the city/town is large enough to protect resident privacy. So, for smaller places, some variables may not be available.
How do I calculate the distance between two cities?
We've published free formulas in popular programming languages. Check them out.
Does the database include commonly known populated places even if they don't have a legal/municipal existence?
Yes, such places are included in our Pro and Comprehensive databases. The field incorporated will have a value of FALSE for such places.
Does the database contain neighborhoods?
No, the database does not typically contained named places that are within other listed towns/cities. The only exception to this is that both New York City and its boroughs (Brooklyn, Manhattan, Queens, The Bronx, and Staten Island) are included. If you need neighborhoods, we have a US Neighborhoods Database.
How do you determine which zip codes are in a city?
Our zip code data comes from our Zip Code Database. Most zip codes are Zip Code Tabulation Areas and are represented as a geographic area. We consider a ZCTA to be part of a city if the area intersecting both the ZCTA and city is at least 10 percent of the area of either the city or the ZCTA. This means that a ZCTA can be in more than one city. If this method does not result in a zip code, we will use the closest zip in the immediate area. For some villages in remote locations (like the Aleutian Islands) no zip code exists.
Has your database been updated with results from the 2020 Census?
Yes, all latitude and longitude coordinates for ZCTAs (and geographic relationships) are now based on ZCTA shapes from the 2020 Census. We're also now using the 2020 American Community Survey (5-year estimate) for demographic data.